Ultima, Bruker Nano
Characteristics
-
- Laser: Mai Tai (Ti:Sapphire) manufactured by SpectraPhysics
- 100fs pulse width
- 80MHz repetition rate
- 740 – 910nm
- 4 detection channels: 2 GaAsPs +2 Multi Alkali PMTs
- Software: Prairie View
- Available objectives:
- 20x water immersion objective (Olympus XLUMPLFL, NA 0.95 )
- 40x water immersion objective (Olympus LUMPLANFL/IR 40 W, NA 0.8)
- 4x air objective (NA 0.28)
- Laser: Mai Tai (Ti:Sapphire) manufactured by SpectraPhysics
OCTOPμS, built in-house
( Optical Coherence Tomography / Oxygen Pressure μ-scope)
Characteristics
- Two-Photon microscope:
- Laser: InSight DeepSee, Spectra Physics, two outputs: tunable 680-1300 nm and fixed 1040 nm
- 4 PMT detectors covering the 440-800 nm emission spectral range,including:
- 1 GaAsP for photon-counting phosphorescence lifetime measurements (for pO2 imaging) and for deep RBC flux measurements
- 1 hybrid photon counting PMT for NADH fluorescence lifetime microscopy
- 2 Multi Alkali PMTs for intensity-based imaging
- Spectral Domain Optical Coherence Tomography
- Light source: SLD, λ0 = 1300nm, Δλ > 170nm
- Tuned for blood flow imaging simultaneously with the 2-Photon Microscopy imaging
- Intrinsic Optical Signal Imaging (IOSI)
- Laser-Speckle Flowmetry
- Confocal Microscopy
Yaseen MA, Srinivasan VJ, Gorczynska I, Fujimoto JG, Boas DA, Sakadžic S. Multimodal optical imaging system for in vivo investigation of cerebral oxygen delivery and energy metabolism. Biomed Opt Express. 2015 Dec 01; 6(12):4994-5007. Schematic
Principle
Applications
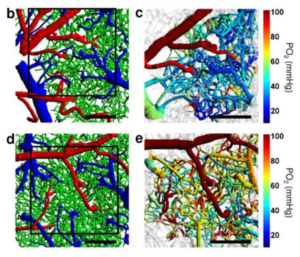
PO2 imaging
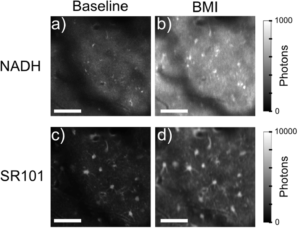
NADH imaging
Applying 2PM for measuring endogenous fluorescence of reduced nicotinamide adenine dinucleotide (NADH) has demonstrated utility as a minimally invasive technique for evaluating metabolic activity.
Deep Red Blood Cell (RBC) flux imaging
A far-red fluorophore such as Alexa680 and photon-counting detection can be used to measure capillary red blood cell flux in both cerebral gray and white matter.